
Highlights


Performance
Stars is built natively for macOS with unmatched performance.
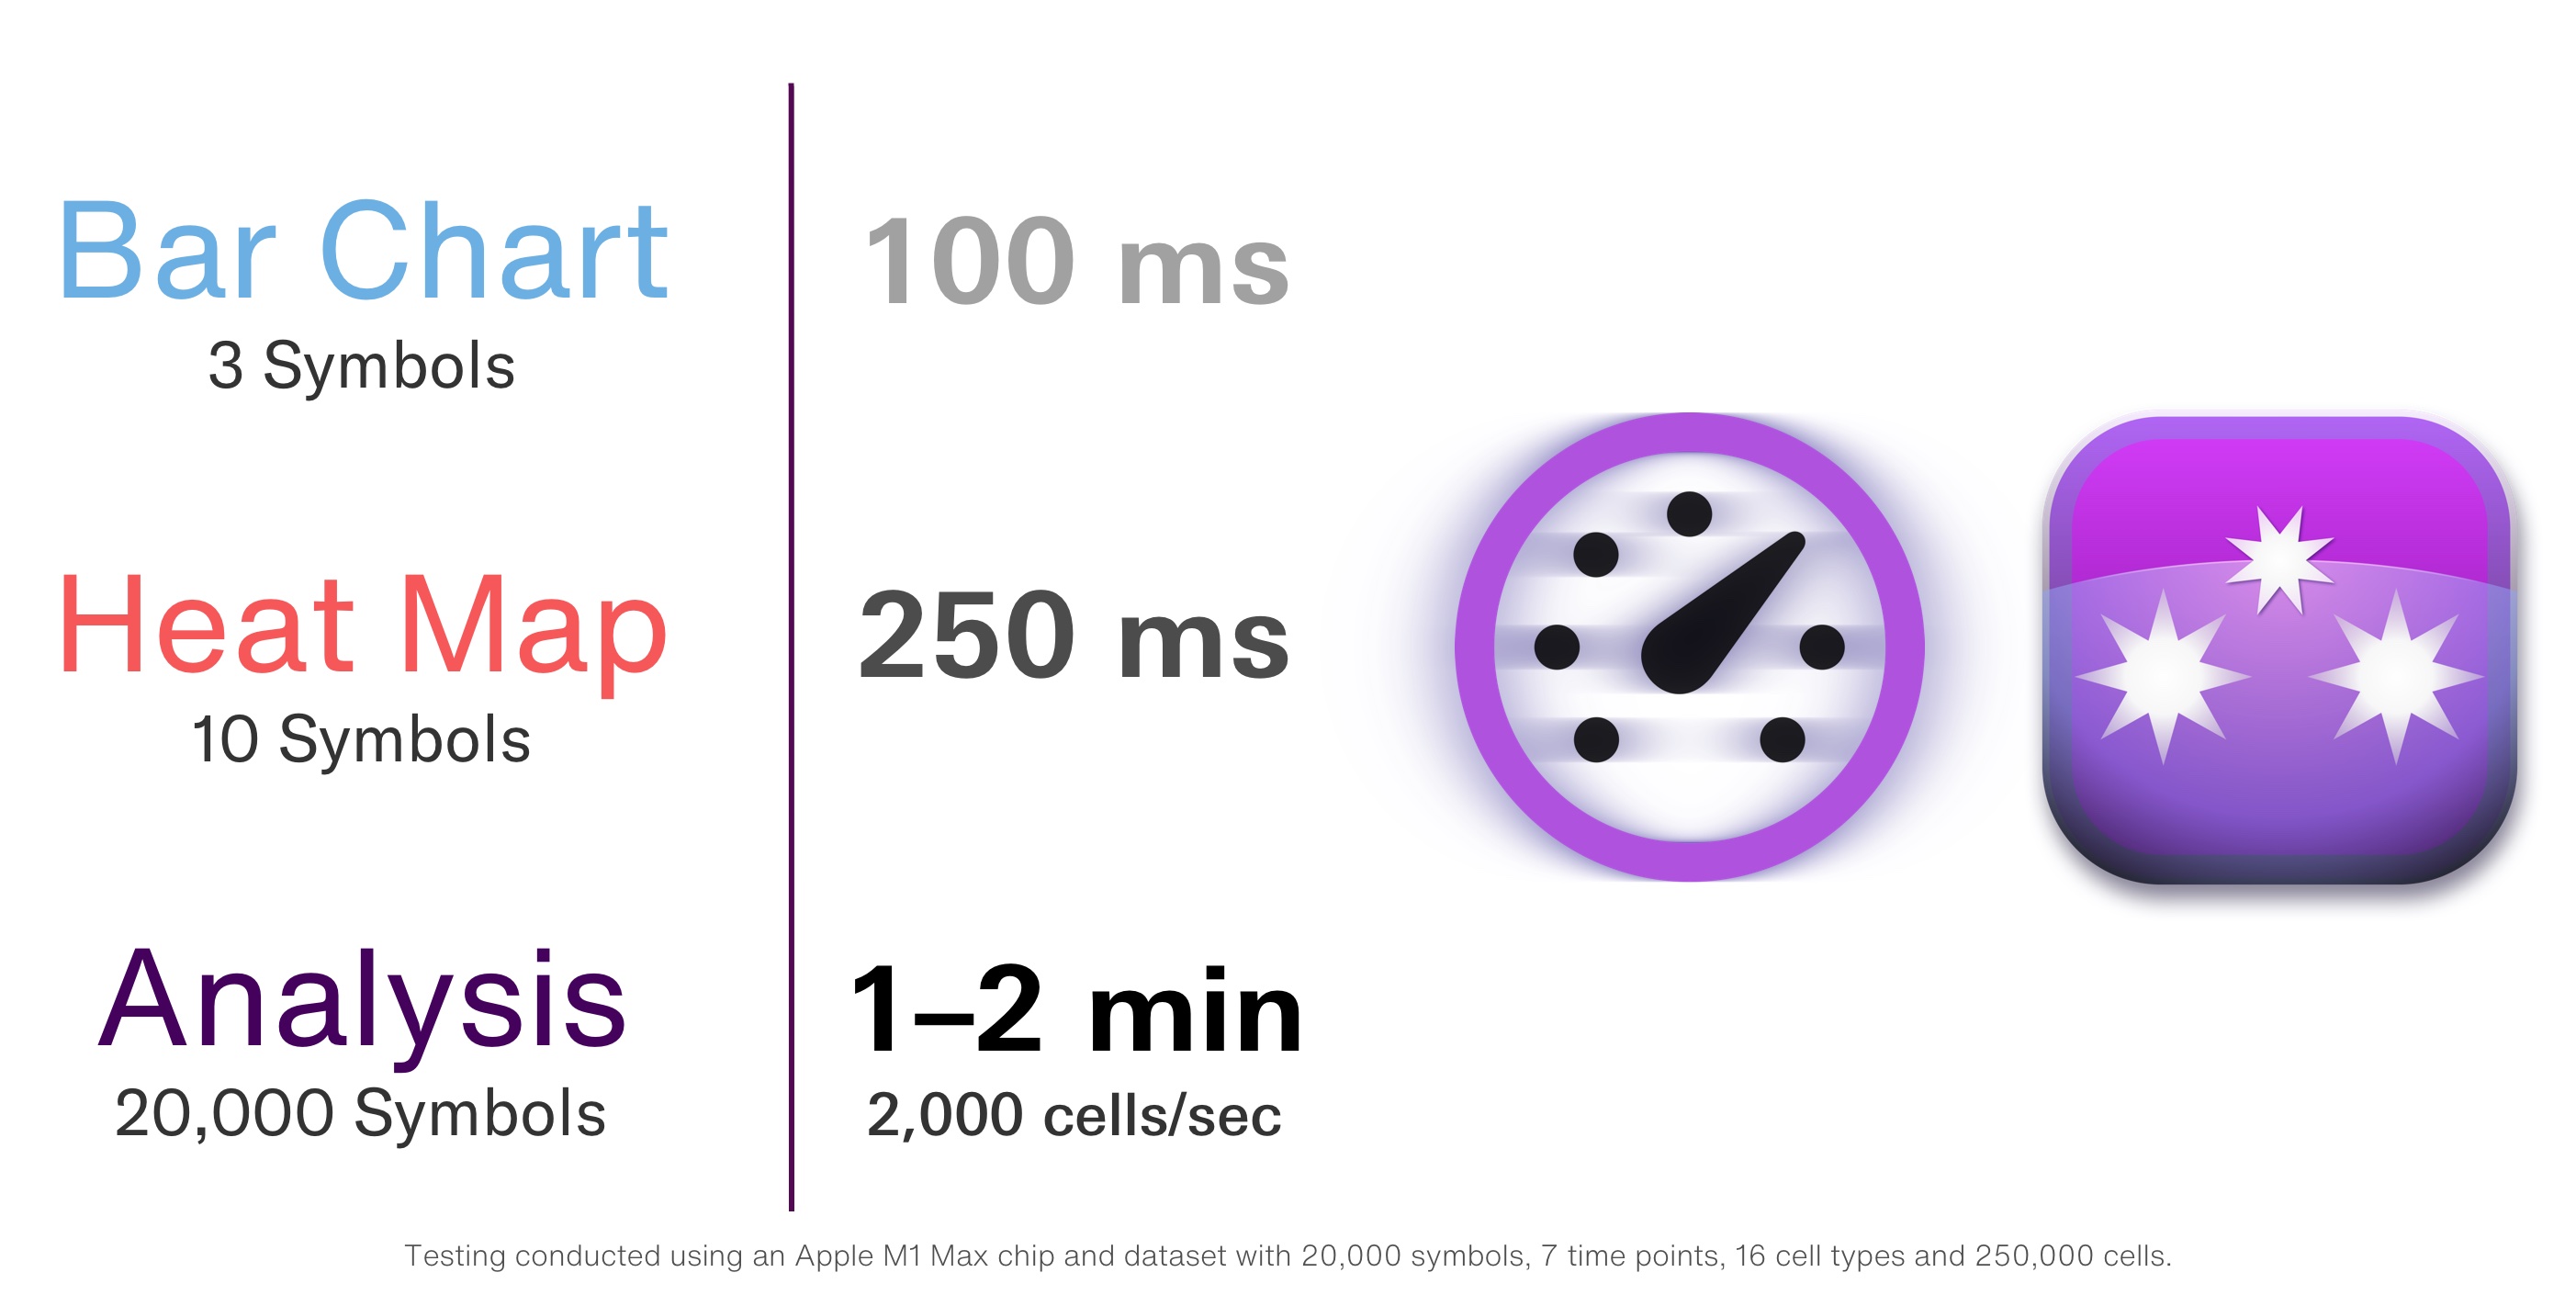
Create charts for simple datasets instantly, and analyze large datasets faster than ever before, on any Mac. Stars leverages the power and efficiency of Apple Silicon to deliver the fastest possible experience (Intel Macs are also supported).
Usability
Stars makes data analysis easy for everyone.
Make your Stars workspace in a matter of minutes (no consolidation of data files required), set up your test groups and perform a search. Don’t know what groups to create? Stars can automatically suggest and create groups for any metadata attribute, and for more complex analysis, you can define your own, versatile groups. Examples include:
- BMI ∈ [20, 25)
- Disease Severity Is Not Equal to “Mild”
- Sex Is Equal to “Male” and Age ≥ 70 and (Smoking Status Is Equal to “Smoker” or Smoking Status Has Prefix “former”)
- Days post-Infection = 7 and Cell Base Type Matches “Monocytes” and Cell Surface Marker Does Not Match CD14
- Sample Type Is Equal to Lesion and Cell Type Matches “Keratinocytes” and Cell Is Positive for One of “KRT1, KRT10” and Cell is Negative for All of “TP53, TP63, TP73”
Relations, groups and other configuration options are saved in a profile, and profiles are saved individually for every dataset, making it easy to switch between different analyses and chart types. All your profiles and settings are conveniently saved in a workspace file that you can easily share with colleagues and friends.
Charts
Bar Charts
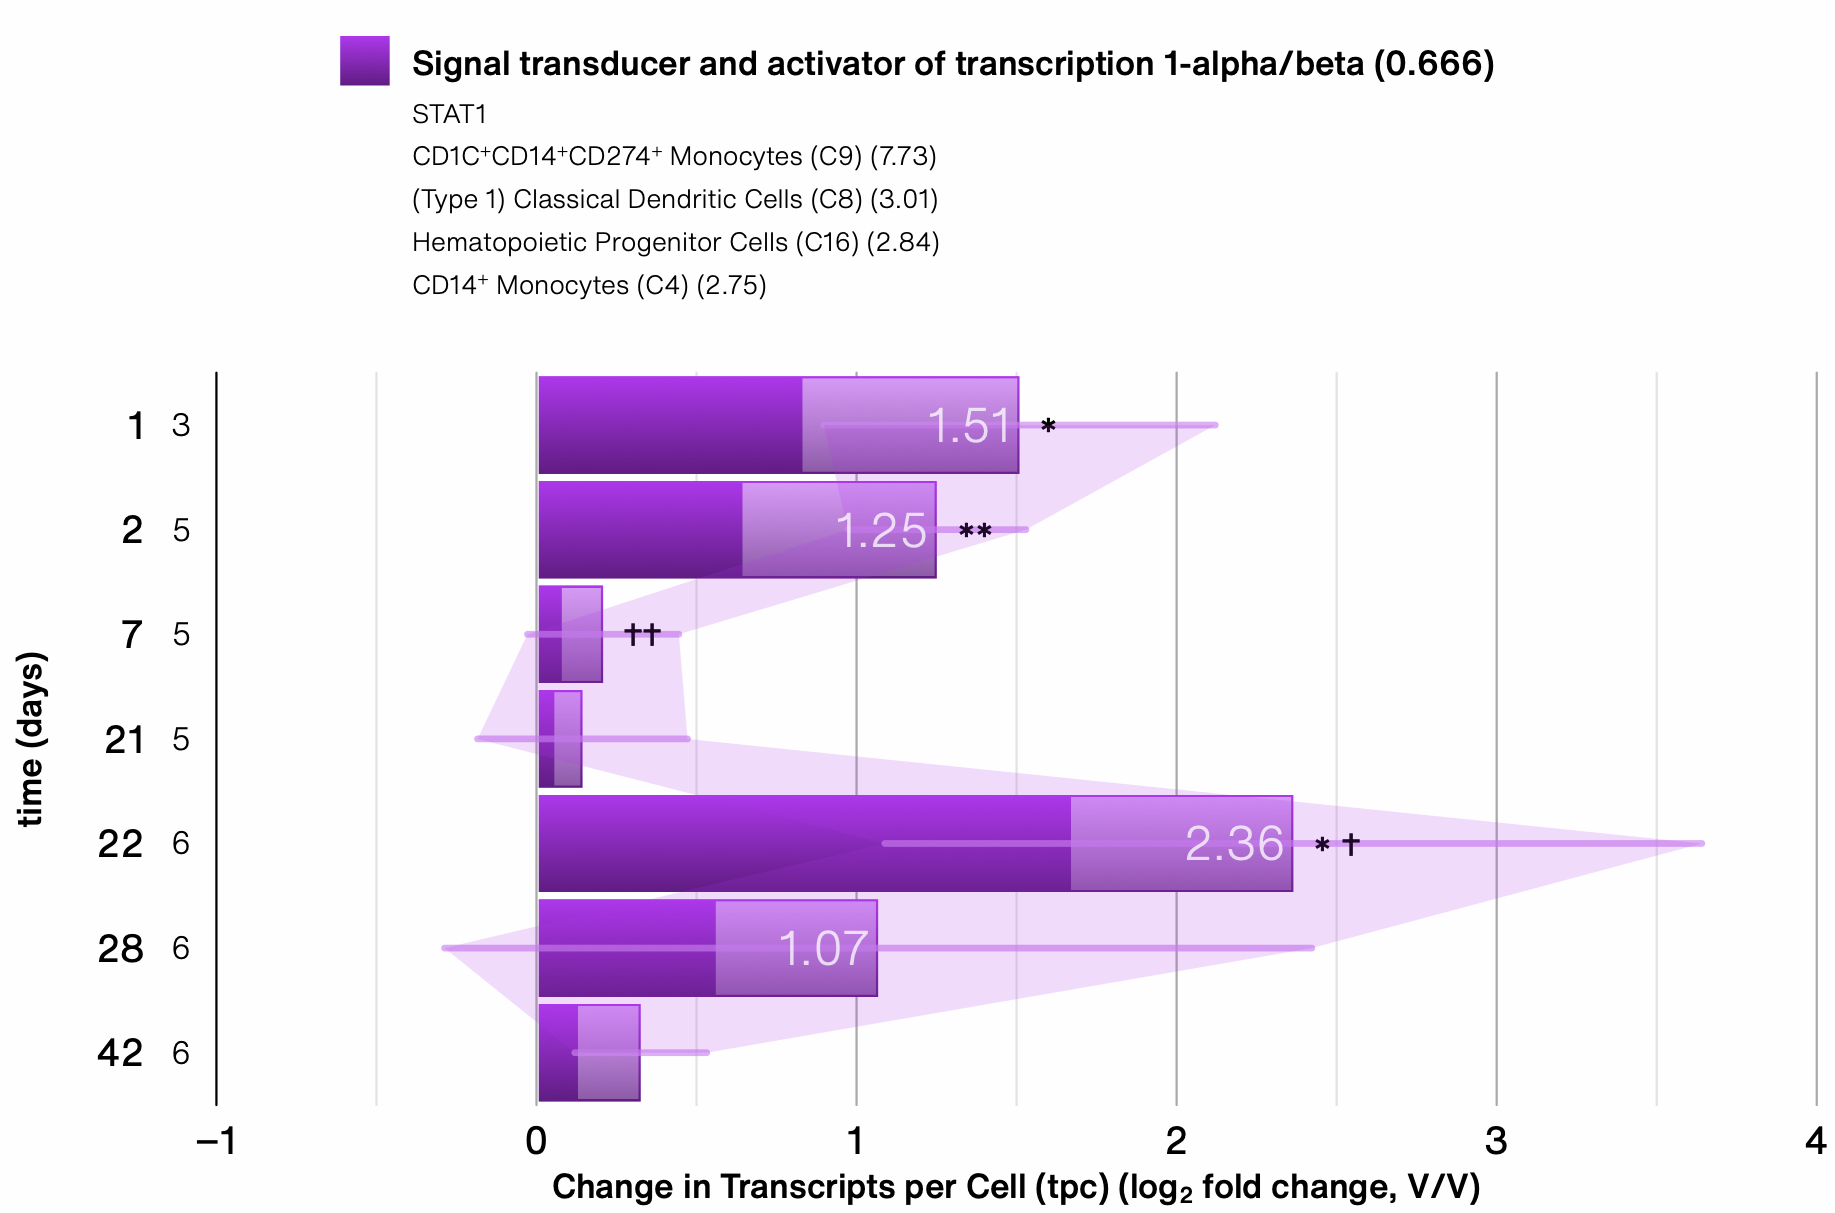
Bar charts are ideal for showing one or a few symbols. The filled percentage of a bar denotes either the percentage of cells, or the percentage of samples in which transcripts could be detected (depending on the dataset). Additionally, the legend shows gene names, cell types with the greatest abundance, and up to 5 metadata attributes that are significantly correlated with the symbol.
Heat Maps
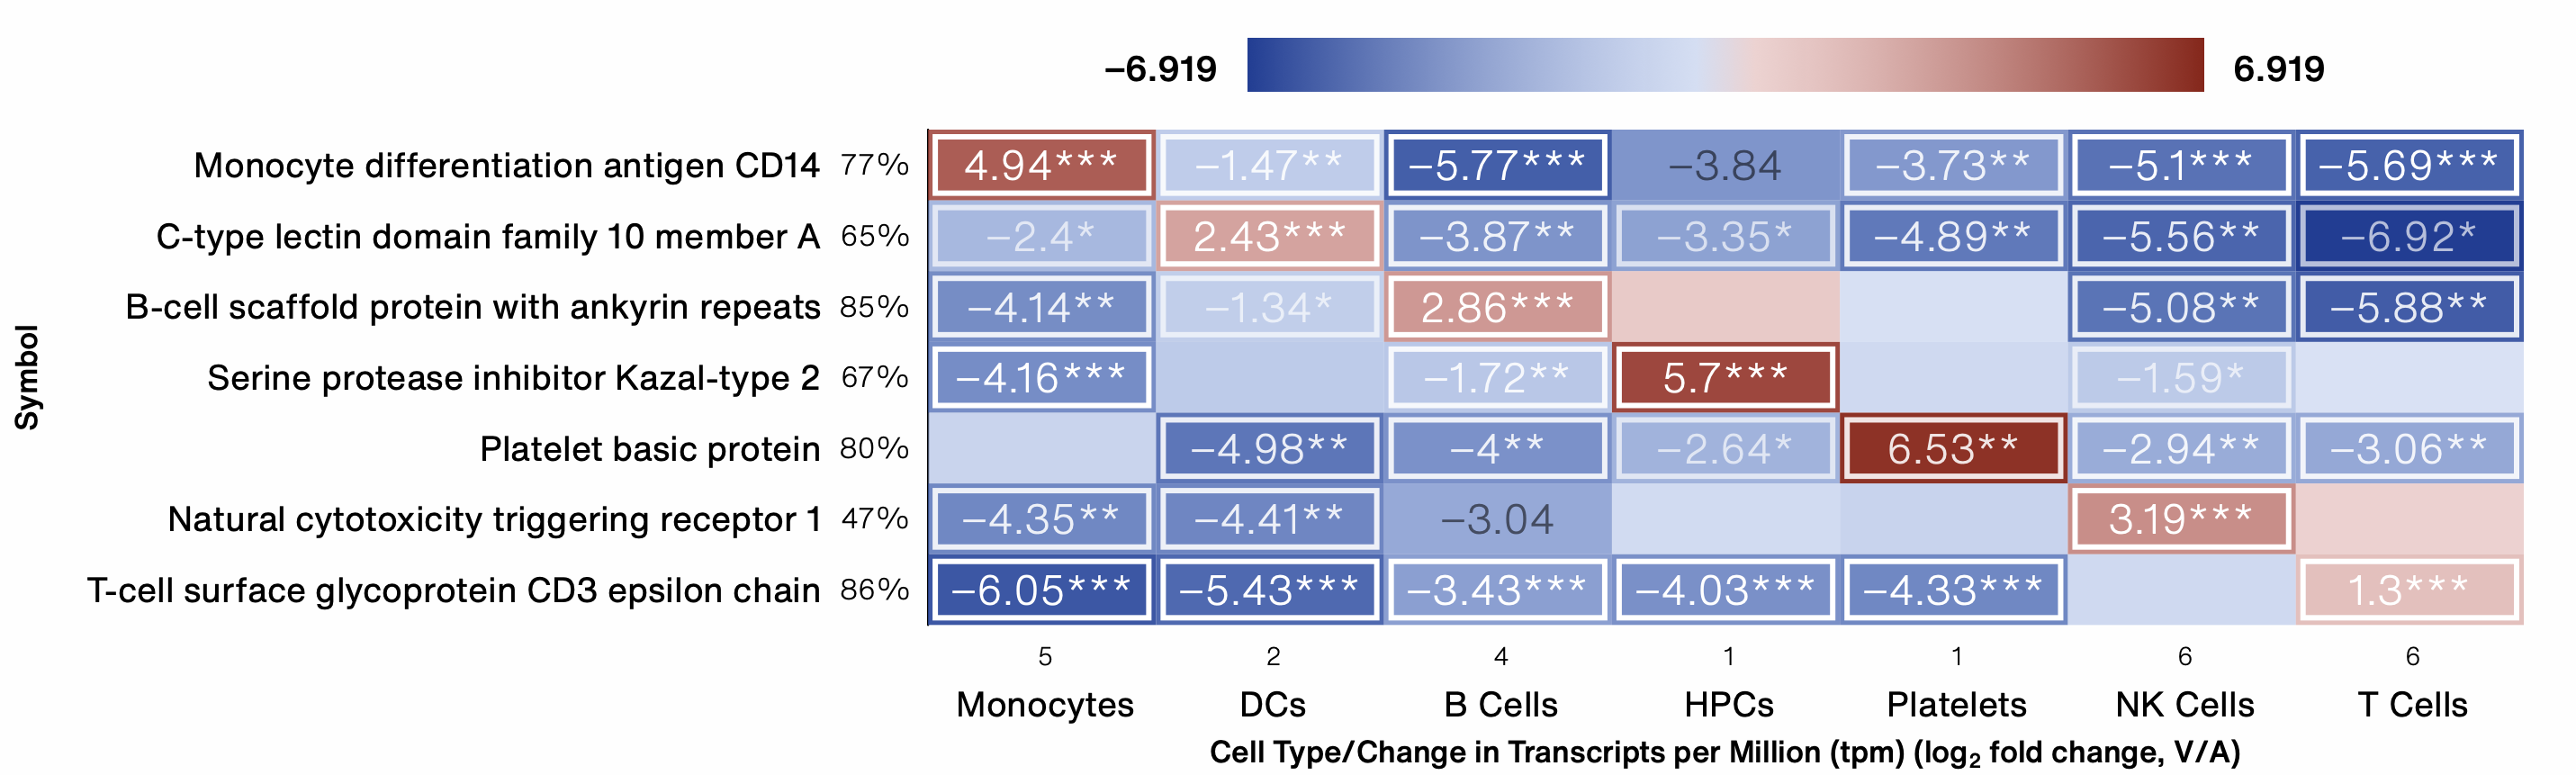
Heat maps offer a compact view of changes in several symbols and groups.
Scatter Plots
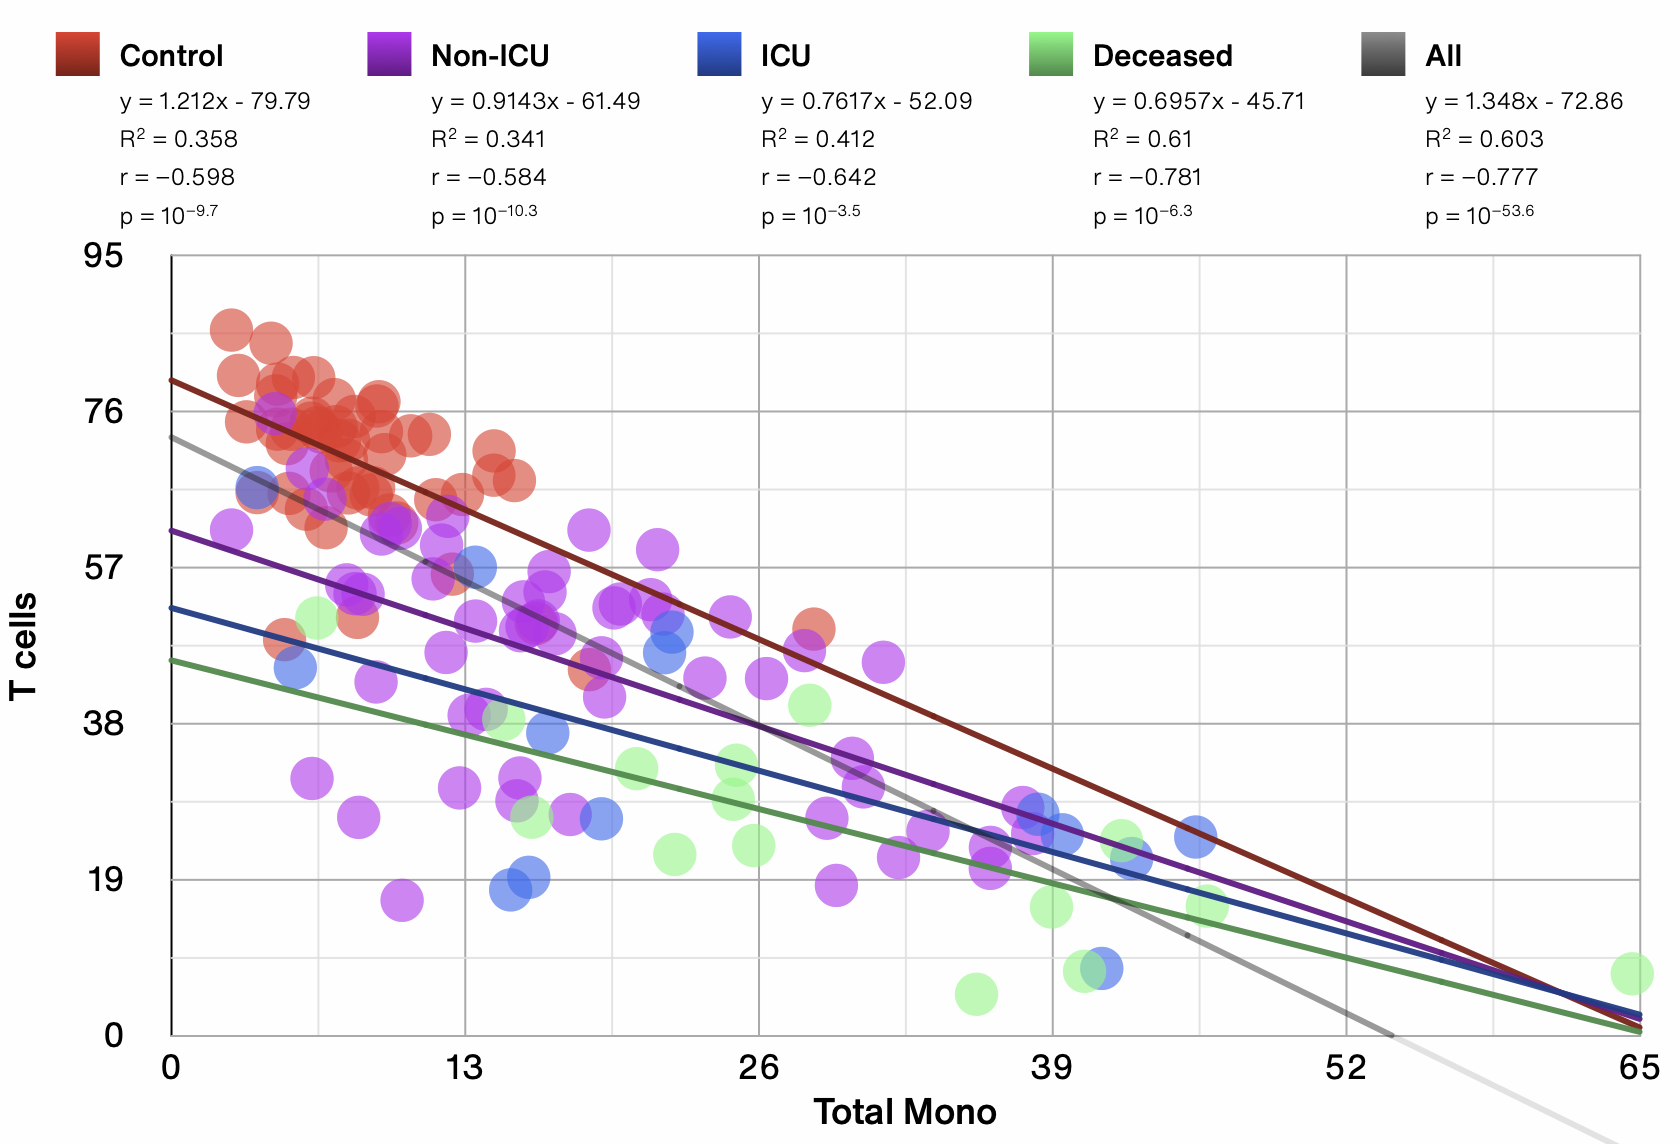
Scatter plots show individual data points, and they’re an excellent option for visualizing relationships between symbols or between symbols and metadata attributes.
Venn Diagrams
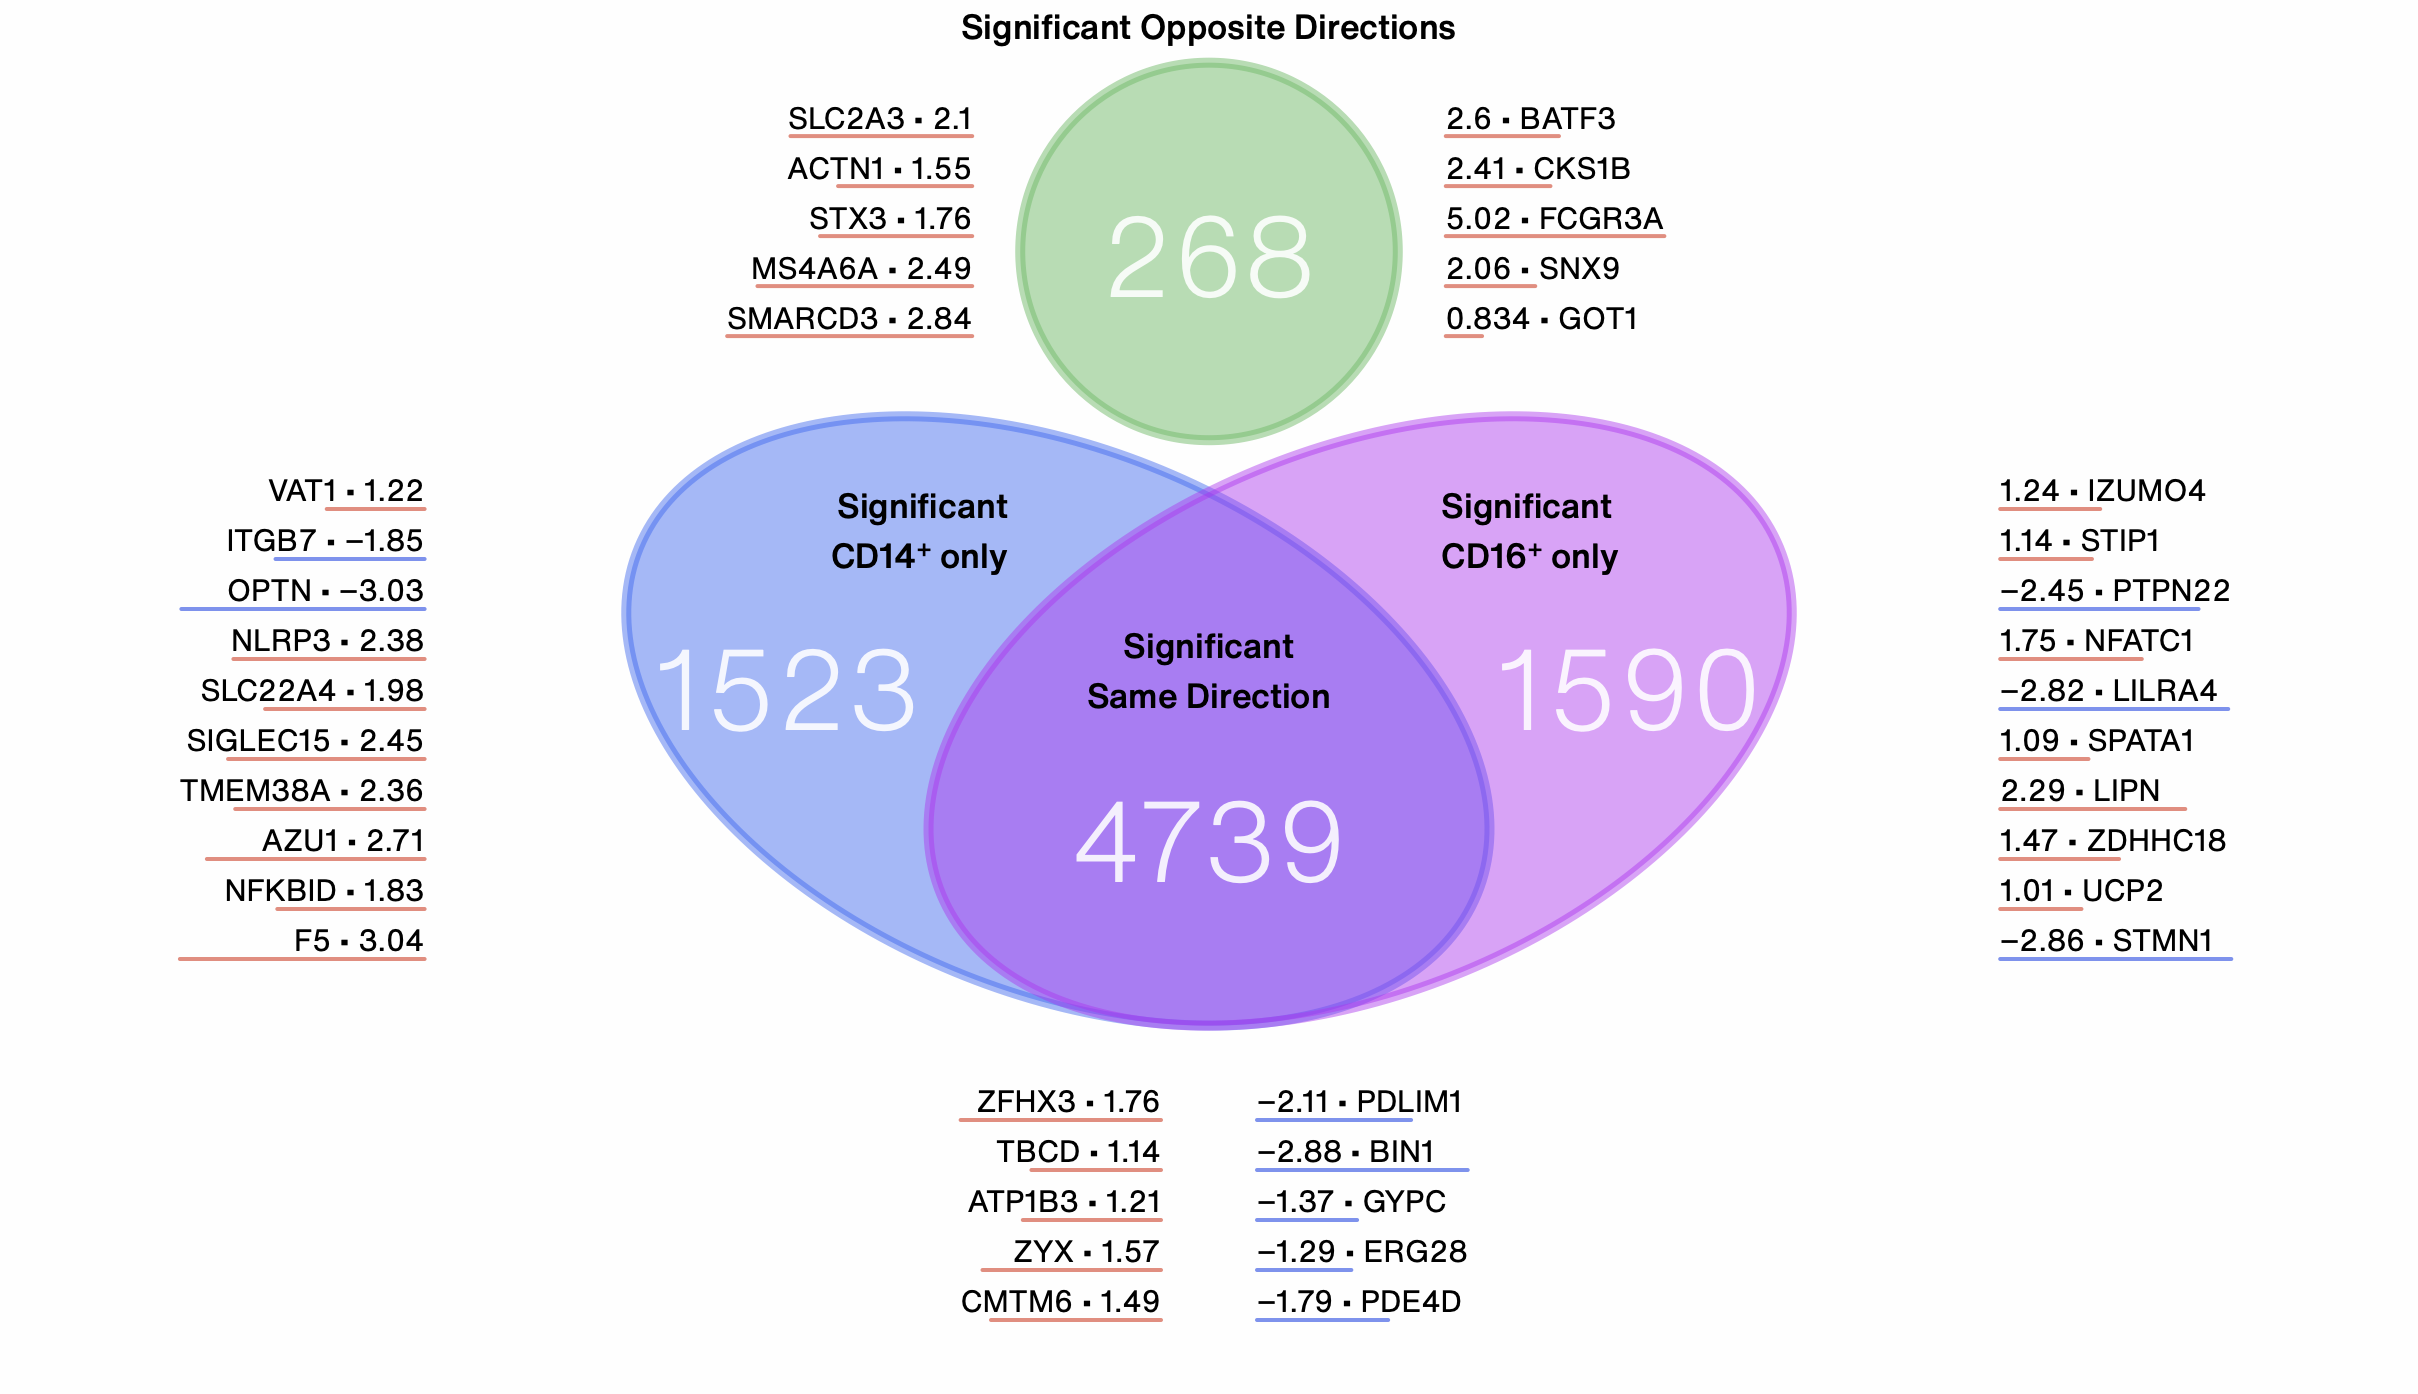
Venn diagrams compare significantly changed symbols between two groups.
Analysis Tools
Most Changed
Find symbols with the greatest change versus Control, sorted by significance, absolute and relative change
Correlations
Stars contains a number of tools for finding correlations between symbols at the sample and single-cell levels, and between symbols/symbol groups and metadata attributes.
Ontology
Find enriched biological processes, cellular components and molecular functions in the dataset
PCA
Perform a PCA and visualize the contribution of each principal component to the dataset’s variance. PCAs can be performed for cells, samples or symbols.
About Stars
We created Stars to make data analysis fast, flexible and fun.
Founder & CTO
Links
Services
Legal
